The course-level Insights area allows an instructor to access a range of data to help them better understand how students are interacting with their course videos.
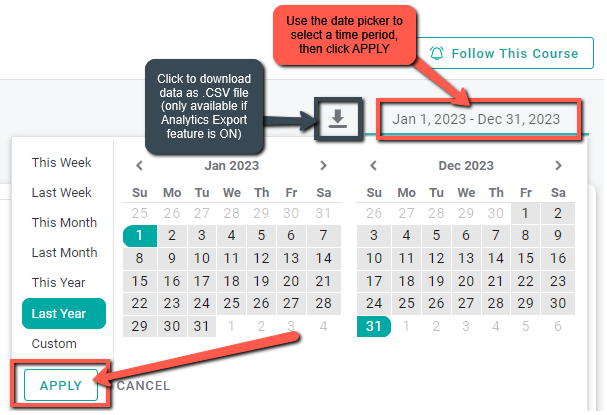
IMPORTANT: To see accurate information in Insights, always make sure to first adjust the selected time and date range. The date picker appears at the top right of each page in the Insights section.
If you have enabled Analytics Export in your Preferences, you will also see a download icon located next to the date picker. Clicking this icon will allow you to download a .CSV (Excel) file containing the current Insights data.
The course-level Insights section is sub-divided into Overview, Videos, Users Activity, and Activity Trends.
- Overview shows how many users have been accessing your course videos, and how many of each type of interaction have taken place during the selected time period.
- Videos includes a list of all course videos added as Kaltura Media Items, with statistics on each video’s activity, average completion rate, numbers of users and views, and types of interactions that have taken place.
- Users Activity shows a list of the course users with similar statistics on their dates of activity, completion rates, video views, and types of interactions used.
- Activity Trends presents a graph showing the numbers and types of participation that have taken place during a selected time period. Within the larger graph, you can click and drag to highlight a smaller time period and view it in greater detail.